4 Charts tell Greenhouse Gas Emissions by Countries&Sectors
February 6, 2020 By Mengpin Ge, Johannes Friedrich and Leandro Vigna
Cover Image by: Marek Piwnicki/Unsplash
This article was updated in August 2021 to reflect the most recent data.
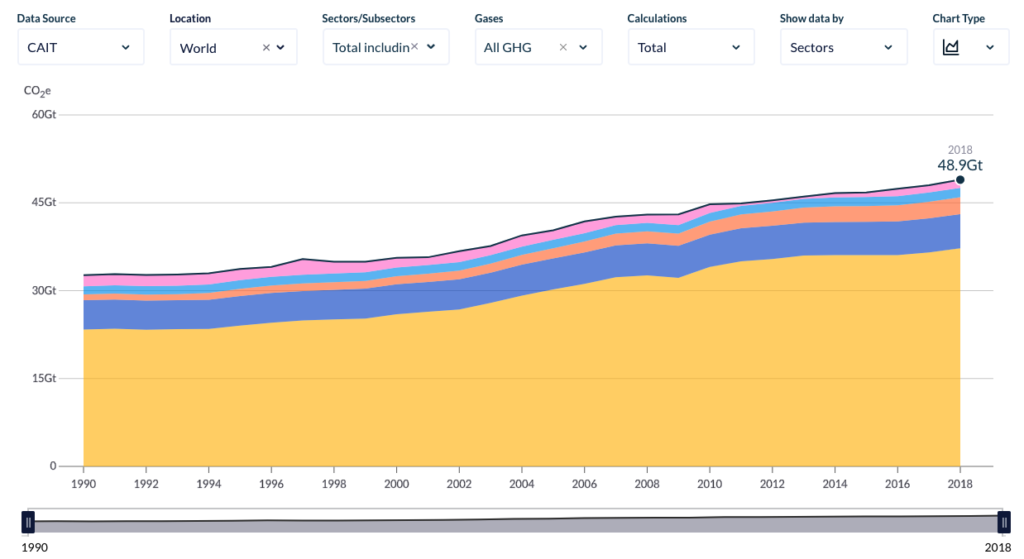
Globally, greenhouse gas emissions have grown by 50% from 1990 to 2018.
Where are these emissions coming from, and who is responsible? WRI’s Climate Watch platform offers comprehensive emissions data for all countries, sectors and gases. Here’s what we know about the sectors and countries driving greenhouse gas emissions globally:
The Energy Sector Produces the Most Greenhouse Gas Emissions
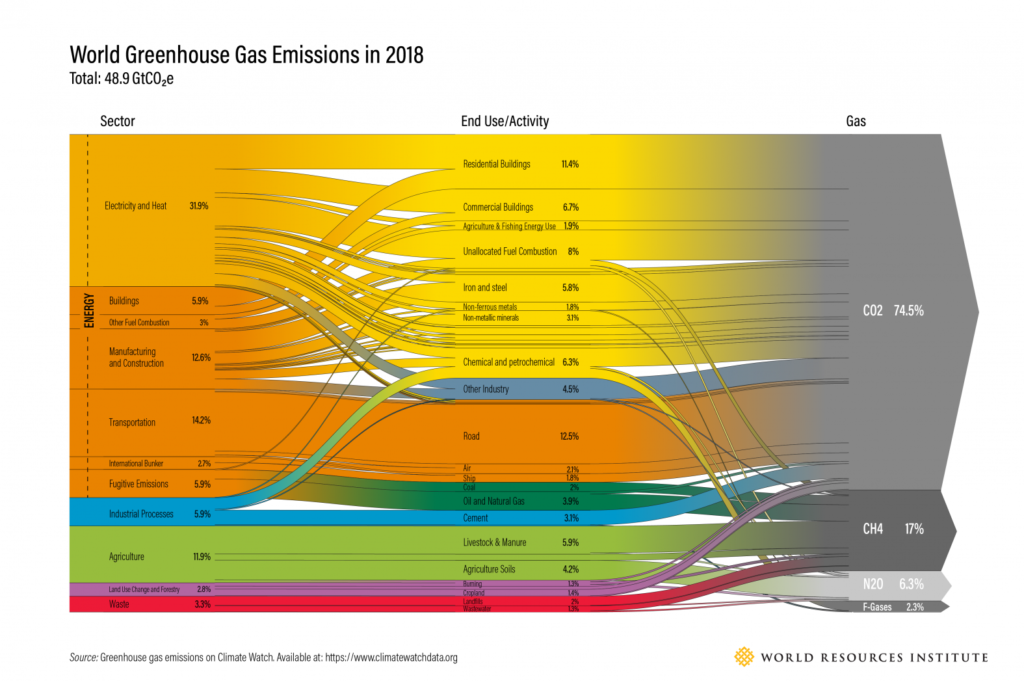
Energy consumption is by far the biggest source of human-caused greenhouse gas emissions, responsible for a whopping 76% (37.2 GtCO2e) worldwide. The energy sector includes transportation, electricity and heat, buildings, manufacturing and construction, fugitive emissions and other fuel combustion.
The other top sectors that produce emissions are agriculture, such as livestock and crop cultivation (5.8 GtCO2e, or 12%); industrial processes of chemicals, cement and more (2.9 GtCO2e, or 5.9%); waste, including landfills and waste water (1.6 GtCO2e, or 3.3%); and land use, land-use change and forestry, such as deforestation (1.4 GtCO2e, or 2.8%).
Within the energy sector, heat and electricity generation is responsible for most emissions (15.6 GtCO2e in 2018, or 31.9% of total greenhouse gas emissions), followed by transportation (6.9 GtCO2e in 2018, or 14.2% of total emissions) and manufacturing and construction (6.2 GtCO2e, or 12.6% of total emissions).
World Greenhouse Gas Emissions in 2018 (Sector | End Use | Gas)
Total: 48.9 GtCO2e
View a static version of this graphic here.
Currently Buildings and Cars Are the Main Contributors of Energy-related Emissions
The middle column of the chart above shows emissions by end-use activities, illustrating the specific activities from which emissions stem. Activities driving most energy emissions include road transportation (12.5% of total emissions), residential buildings (11.4% of total emissions) and commercial buildings (6.7% of total emissions). Emissions from those activities include both direct emissions from fossil fuel combustion, as well as indirect emissions from activities such as use of electricity.
Outside of energy, major drivers include livestock and manure (5.9%), other industry (4.5%) and agricultural soils (4.2%). The “other industry” category contains all activities that do not squarely fall within the other categories. As such, it covers a wide range of activities, including non-metallic metals, construction, mining and quarrying, textile and leather, wood and wood products, transportation equipment and more.
Industry and Transportation Are the Fastest Growing Sources of Greenhouse Gas Emissions
Since 1990, three sectors stand out as the fastest-growing sources of greenhouse gas emissions: Industrial processes grew by 187%, transportation (a subsector of energy) by 79% and manufacturing and construction (also a subsector of energy) by 56%. The growth in industrial emissions stems not only from CO2 emissions, but also the increased use of refrigeration and air conditioning. These activities produce hydrofluorocarbons (HFCs) which are potent greenhouse gases. Increased travel by automobiles is the predominant reason transportation emissions are on the rise
In comparison, emissions from the largest-emitting subsector within the energy sector, electricity and heat generation, increased 78% from 1990 to 2013, but then dropped by 2.4% between 2013 and 2016. The decrease was driven by various factors, including a shift to natural gas from coal and increased use of renewables. However, the latest carbon emissions data suggests that emissions from this energy subsector rose again in 2017 and 2018 by 1.3% and 2% respectively, while maintaining a marginal increase of 0.06% in 2019.
10 Countries Produce More than 68% of Global Greenhouse Gas Emissions
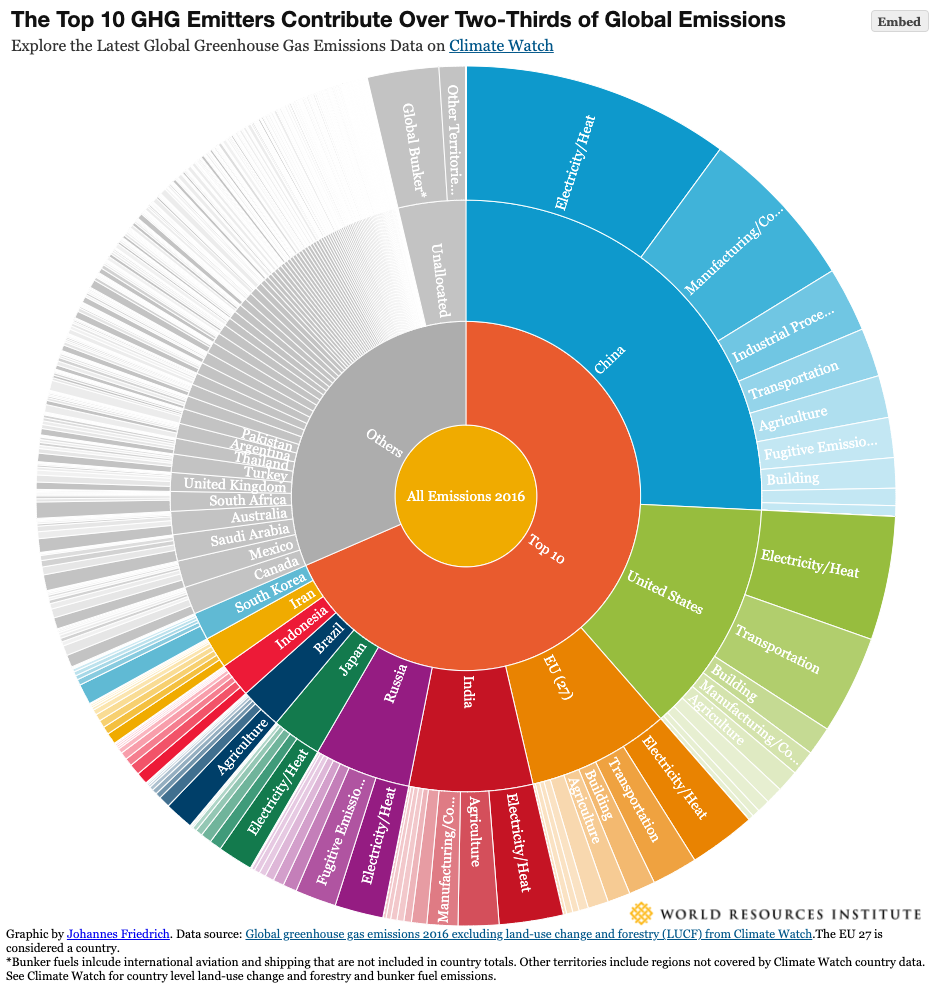
A small number of countries contribute most of the greenhouse gas emissions, with the top 10 emitters accounting for over two-thirds of annual global greenhouse gas emissions. Most of them also have large populations and economies, together accounting for over 50% of the global population and 75% of the world’s GDP. China is the biggest emitter at 26.1% of global greenhouse gas emissions, followed by the United States at 12.67%, the European Union at 7.52% and India at 7.08%.*
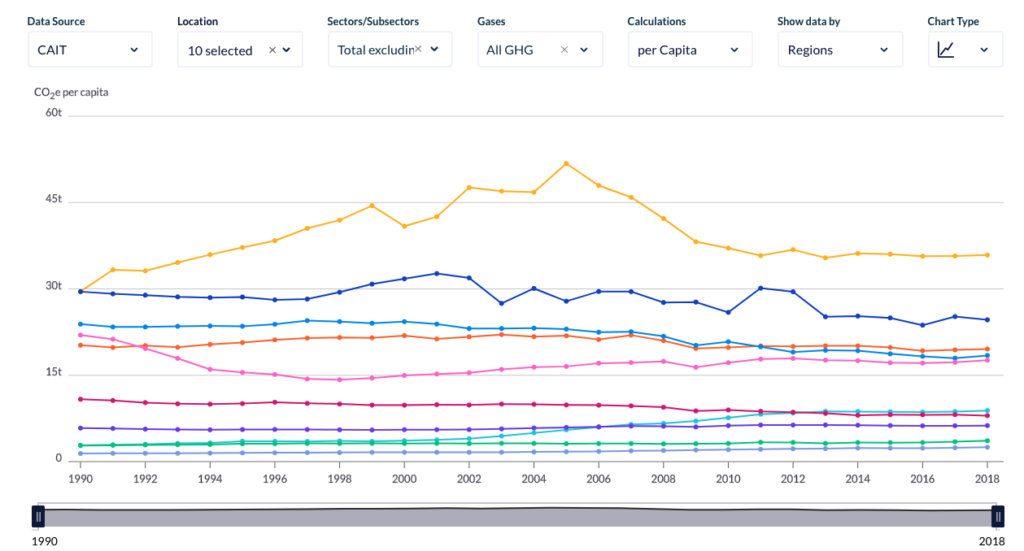
Most of the top 10 emitters have higher emissions per person than the world average (around 6.45 tCO2e per person). Among the top 10 total greenhouse gas emitters, Canada and the United States have the highest per capita greenhouse gas emissions at 20.6 tCO2e per person and 17.74 tCO2e per person, respectively, while India has the lowest at 2.47 tCO2e per person. China’s per capita emissions (8.4 tCO2e) continue to rise, surpassing those of the European Union (7.46 tCO2e).
Countries such as Qatar and Australia, while not among the top 10 emitters, have higher per capita emissions than most top emitters at 35.89 tCO2e per person and 24.79 tCO2e per person, respectively.
Carbon Dioxide Makes Up Most, But Not All, Greenhouse Gas Emissions
Carbon dioxide (CO2) comprises 74% of greenhouse gas emissions. Most CO2 emissions (93%) are from the use of fossil fuels, especially for generation of electricity and heat, transportation and manufacturing and consumption. Land use, land-use change and forestry is another contributor (3.3%) to human-made CO2 emissions, mostly due to deforestation.
Methane (CH4) and nitrous oxide (N2O) make up 17.2% and 6.3% of total greenhouse gas emissions, respectively, mostly from agriculture, waste treatment and gas flaring. Fluorinated gases (comprised of HFCs, perfluorocarbons (PFCs), sulfur hexafluoride (SF6) and nitrogen trifluoride (NF3)) from industrial processes make up 2.3% of global emissions. These gases are much more potent than CO2 in terms their global warming potential, and often provide overlooked opportunities for mitigation.
Greenhouse Gas Emissions Must Be Reduced Rapidly to Avert the Climate Crisis
The world is already facing the consequences from climate change. To avoid much more dangerous and costly impacts, current levels of greenhouse gas emissions must be slashed in half by 2030 and reach net-zero by mid-century.
All countries, particularly major economies, need to step up their climate ambition and submit new or updated strengthened national climate plans. Globally, 2030 greenhouse gas emissions need to be 55% lower than in the initial round of nationally determined contributions (NDCs) in order to limit warming to 1.5 degrees C and prevent the worst impacts of climate change. The largest emissions sources, like the energy sector, are good places to start.
But fully tackling the climate crisis will require deep reductions across all sectors, big and small. For example, the State of Climate Action report finds that in order for the world to get on track for the emission cuts required by 2030, we need to phase out coal in electricity generation five times faster, accelerate the increase in annual tree cover gain five times faster and accelerate the increase in share of low-carbon fuels by eight times faster, among other actions. Switching to renewable energy, electrifying the transportation sector, introducing more sustainable agriculture practices, curbing deforestation and forest degradation and producing less waste are a few critical steps to drive greenhouse gas emissions downward and set the world on course for a safer future.
*All the values here are based on total GHG emissions without land use, land-use change and forestry. The EU (27) is considered a country in this chart. Note that emissions from land use, land-use change and forestry (LUCF) are not allocated to countries in this chart as values can be negative. Bunker fuels include international aviation and shipping are not included in country totals. Other territories include regions not covered by Climate Watch country data. See Climate Watch for allocation of land use, land-use change and forestry and bunker fuel emissions.
All copy and source from WRI.org